Effective Methods and Importance of Time Series Data Analysis in Data Science
Time series data analysis plays a crucial role in the field of data science, providing valuable insights into trends, patterns, and anomalies over time. Understanding effective methods for analyzing time series data is essential for making accurate forecasts and informed decisions based on historical data.
Introduction
Welcome to the introduction section of this article on the importance and effective methods of time series data analysis in the field of data science. In this section, we will provide an overview of what time series data analysis entails and why it is crucial for making informed decisions based on historical data.
Overview of Time Series Data Analysis
Time series data analysis involves the study of data points collected, recorded, or observed over a period of time. This type of data is sequential in nature, with each data point being recorded at regular intervals. Time series data analysis helps in uncovering patterns, trends, and anomalies that may not be apparent in other types of data analysis.
One of the key aspects of time series data analysis is the ability to make forecasts based on historical data. By analyzing past trends and patterns, data scientists can make predictions about future outcomes, which can be invaluable for businesses and organizations in planning and decision-making.
Moreover, time series data analysis plays a crucial role in anomaly detection. By identifying deviations from the expected patterns, data scientists can pinpoint potential issues or irregularities that may require further investigation. This can be particularly useful in various industries such as finance, healthcare, and Manufacturing.
Overall, time series data analysis provides valuable insights into the dynamics of data over time, enabling data scientists to extract meaningful information and make data-driven decisions. In the following sections, we will delve deeper into the importance of time series data analysis, effective methods for analyzing time series data, preprocessing techniques, evaluation metrics, and applications in various fields.
Importance of Time Series Data Analysis
Time series data analysis is of paramount importance in the field of data science as it allows for the extraction of valuable insights from sequential data collected over time. By analyzing trends, patterns, and anomalies in time series data, businesses and organizations can make informed decisions and accurate forecasts based on historical data.
Forecasting Trends
One of the key benefits of time series data analysis is its ability to forecast trends based on historical data. By analyzing past patterns and trends, data scientists can predict future outcomes with a certain level of accuracy. This forecasting capability is crucial for businesses in planning and decision-making, as it provides a glimpse into what the future may hold.
Pattern Recognition
Time series data analysis also enables pattern recognition, allowing data scientists to identify recurring patterns in the data. By recognizing these patterns, businesses can gain insights into consumer behavior, market trends, and other important factors that can influence decision-making. Pattern recognition is essential for understanding the underlying dynamics of the data and making informed predictions.
Anomaly Detection
Another critical aspect of time series data analysis is anomaly detection. By analyzing deviations from expected patterns, data scientists can identify anomalies or irregularities in the data that may require further investigation. Anomaly detection is particularly important in industries such as finance, healthcare, and manufacturing, where even small deviations can have significant consequences.
Overall, the importance of time series data analysis cannot be overstated. By leveraging effective methods and techniques for analyzing time series data, businesses can gain valuable insights, make accurate forecasts, and detect anomalies that may Impact their operations. Time series data analysis is a powerful tool for data-driven decision-making and is essential for staying ahead in today’s competitive Business landscape.
Effective Methods for Time Series Data Analysis
When it comes to analyzing time series data, there are several effective methods that data scientists can employ to extract valuable insights and make accurate forecasts. Let’s explore some of the key methods used in time series data analysis:
ARIMA Modeling
arima, which stands for Autoregressive Integrated Moving Average, is a popular method for time series forecasting. This approach involves modeling the relationship between an observation and a number of lagged observations, as well as the difference between the observations at different time points. ARIMA models are versatile and can be applied to a wide range of time series data, making them a valuable tool for data scientists.
One of the key advantages of ARIMA modeling is its ability to capture both trend and seasonality in the data. By incorporating autoregressive and moving average components, ARIMA models can effectively model complex patterns in the data, allowing for accurate forecasting of future trends.
However, ARIMA modeling does have its limitations. For instance, ARIMA models may not perform well on data with irregular patterns or sudden changes in behavior. In such cases, data scientists may need to explore other methods or techniques to improve the accuracy of their forecasts.
Seasonal Decomposition
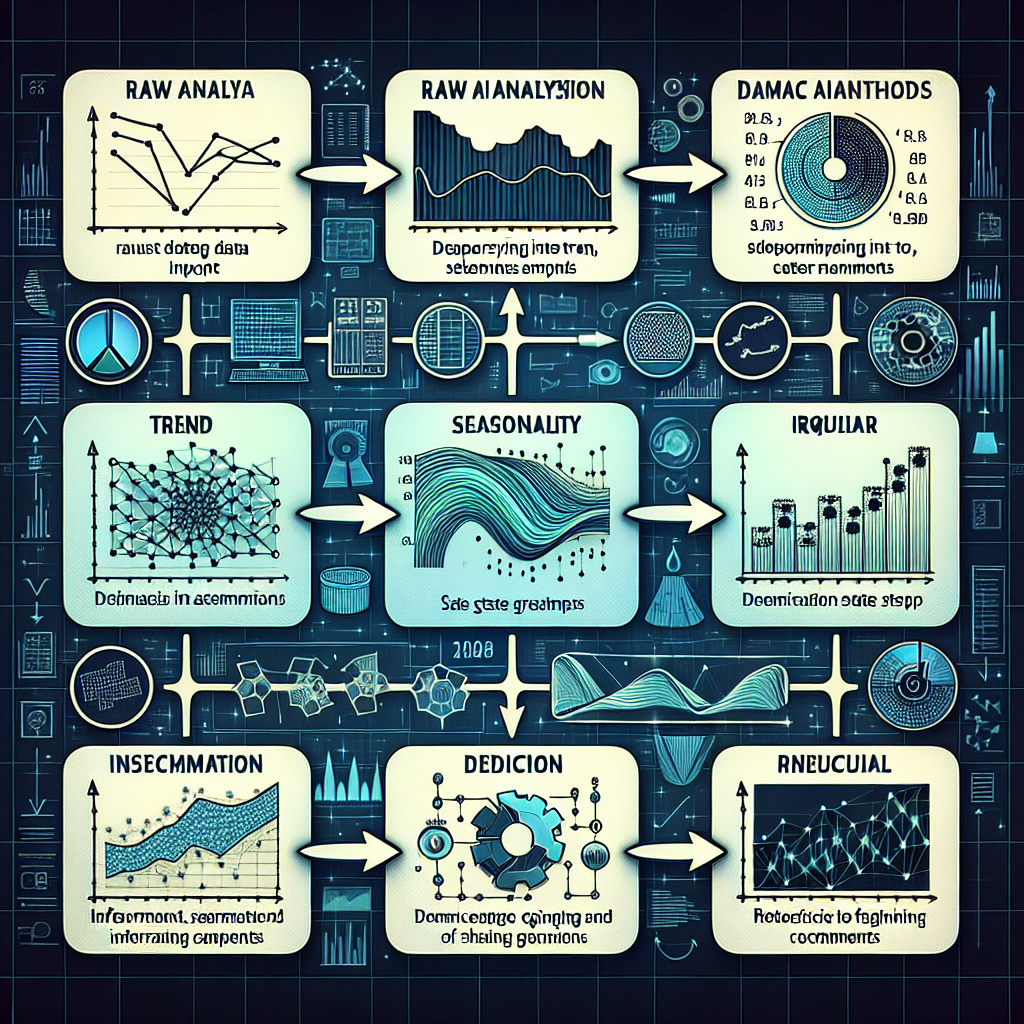
Seasonal decomposition is another method commonly used in time series data analysis to separate the trend, seasonal, and residual components of a time series. This technique is particularly useful for identifying seasonal patterns and trends that may exist in the data, allowing data scientists to make more accurate forecasts.
By decomposing the time series into its constituent components, data scientists can better understand the underlying dynamics of the data and make informed decisions based on the individual components. Seasonal decomposition can help in identifying recurring patterns and trends that may not be apparent when looking at the data as a whole.
One of the challenges of seasonal decomposition is determining the appropriate method for decomposing the time series. There are various techniques available, such as additive or multiplicative decomposition, and data scientists may need to experiment with different approaches to find the most suitable method for their data.
Machine Learning Approaches
machine learning approaches have become increasingly popular in time series data analysis due to their ability to handle complex patterns and relationships in the data. machine learning algorithms, such as neural networks, support vector machines, and random forests, can be used to make accurate forecasts and predictions based on historical data.
One of the key advantages of machine learning approaches is their flexibility and adaptability to different types of time series data. These algorithms can automatically learn from the data and adjust their models to capture changing patterns and trends, making them a powerful tool for data scientists.
However, machine learning approaches may require a large amount of data to train effectively, and they can be computationally intensive. Data scientists may also need to fine-tune the parameters of the machine learning algorithms to achieve optimal performance, which can be a time-consuming process.
In conclusion, ARIMA modeling, seasonal decomposition, and machine learning approaches are just a few of the effective methods that data scientists can use for analyzing time series data. By leveraging these methods and techniques, businesses and organizations can gain valuable insights, make accurate forecasts, and make data-driven decisions based on historical data.
Preprocessing Techniques for Time Series Data
When working with time series data, it is essential to apply preprocessing techniques to ensure the data is clean, normalized, and engineered with relevant features. Let’s explore some common preprocessing techniques used in time series data analysis:
Data Cleaning
data cleaning is the process of identifying and correcting errors or inconsistencies in the time series data. This may involve removing missing values, handling outliers, and addressing any anomalies that could affect the accuracy of the analysis. By cleaning the data, data scientists can ensure that the information used for modeling is reliable and accurate.
One common approach to data cleaning is imputation, where missing values are filled in using statistical methods or by extrapolating from existing data points. Another technique is outlier detection, which involves identifying and removing data points that deviate significantly from the rest of the dataset. Data cleaning is crucial for ensuring the quality of the data and the accuracy of the analysis results.
Normalization
Normalization is the process of scaling the values of the time series data to a standard range, typically between 0 and 1. This allows for a more consistent comparison of different variables within the dataset and prevents certain features from dominating the analysis due to their larger scale. Normalization is important for ensuring that all variables contribute equally to the analysis and that the model is not biased towards certain features.
One common normalization technique is min-max scaling, where the values are transformed to fall within a specified range. Another approach is z-score normalization, which standardizes the data by subtracting the mean and dividing by the standard deviation. Normalization helps in improving the performance of machine learning models and ensuring that the analysis is not skewed by the scale of the data.
Feature Engineering
feature engineering involves creating new features or transforming existing ones to improve the performance of the time series analysis. This may include extracting relevant information from the data, creating lag features, or encoding categorical variables for modeling. Feature engineering is essential for capturing important patterns and relationships in the data that may not be apparent initially.
One common feature engineering technique is creating lag features, where past values of the time series are included as predictors for future values. This allows the model to capture temporal dependencies and trends in the data. Another approach is one-hot encoding, which converts categorical variables into binary vectors for analysis. Feature engineering is crucial for enhancing the predictive power of the model and extracting meaningful insights from the time series data.
Evaluation Metrics for Time Series Models
When it comes to evaluating the performance of time series models, there are several key metrics that data scientists use to assess the accuracy of their forecasts. Two commonly used evaluation metrics for time series models are Root Mean Squared Error (RMSE) and Mean Absolute Percentage Error (MAPE).
Root Mean Squared Error (RMSE)
RMSE is a popular metric for measuring the accuracy of a model’s predictions by calculating the square root of the average of the squared differences between the predicted values and the actual values. RMSE provides a measure of how well the model’s predictions align with the true values, with lower RMSE values indicating better performance.
One of the advantages of using RMSE is that it penalizes large errors more heavily than small errors, making it a robust metric for assessing the overall accuracy of a time series model. RMSE is widely used in various industries, including finance, healthcare, and manufacturing, to evaluate the performance of forecasting models.
However, RMSE does have some limitations. For instance, RMSE is sensitive to outliers in the data, which can skew the results and affect the interpretation of the model’s performance. Data scientists may need to preprocess the data to handle outliers effectively when using RMSE as an evaluation metric.
Mean Absolute Percentage Error (MAPE)
MAPE is another commonly used metric for evaluating the accuracy of time series models by calculating the average of the absolute percentage errors between the predicted values and the actual values. MAPE provides a measure of the relative accuracy of the model’s predictions, with lower MAPE values indicating better performance.
One of the key advantages of using MAPE is that it provides a percentage-based measure of error, making it easier to interpret and compare the performance of different models. MAPE is particularly useful for assessing the accuracy of forecasting models in industries where relative errors are more important than absolute errors.
However, MAPE also has its limitations. For instance, MAPE can be sensitive to zero values in the actual data, leading to infinite values in the calculation. Data scientists may need to handle zero values appropriately or consider using alternative metrics in such cases to avoid biased results.
In conclusion, RMSE and MAPE are valuable evaluation metrics for assessing the accuracy of time series models and forecasting performance. By using these metrics effectively, data scientists can measure the quality of their predictions, identify areas for improvement, and make informed decisions based on the Reliability of their models.
Applications of Time Series Data Analysis
Time series data analysis has a wide range of applications across various industries, providing valuable insights and enabling data-driven decision-making. Let’s explore some of the key applications of time series data analysis:
Financial Forecasting
One of the most common applications of time series data analysis is financial forecasting. In the financial industry, accurate predictions of stock prices, market trends, and economic indicators are crucial for making informed investment decisions. Time series data analysis helps in analyzing historical data to identify patterns and trends that can be used to forecast future financial outcomes.
By leveraging time series data analysis techniques, financial institutions can predict stock market movements, interest rates, and currency fluctuations with a certain level of accuracy. These forecasts are essential for managing risks, optimizing investment portfolios, and maximizing returns on investments.
Moreover, time series data analysis is also used in risk management and fraud detection in the financial sector. By analyzing transaction data and identifying anomalies or irregularities, financial institutions can detect fraudulent activities and mitigate risks effectively.
Healthcare Analytics
Healthcare analytics is another important application of time series data analysis, offering valuable insights into patient outcomes, disease trends, and healthcare resource utilization. By analyzing time series data collected from electronic health records, wearable devices, and medical sensors, healthcare providers can improve patient care, optimize treatment plans, and reduce healthcare costs.
Time series data analysis is used in healthcare for predicting disease outbreaks, monitoring the effectiveness of treatments, and identifying patients at risk of developing certain conditions. By analyzing trends in patient data over time, healthcare providers can personalize treatment plans, improve patient outcomes, and enhance the overall quality of care.
Furthermore, time series data analysis plays a crucial role in healthcare operations management, helping hospitals and healthcare facilities optimize resource allocation, reduce waiting times, and improve patient flow. By analyzing historical data on patient admissions, bed utilization, and staffing levels, healthcare organizations can enhance operational efficiency and deliver better services to patients.
Demand Prediction
Demand prediction is a key application of time series data analysis in various industries, including retail, e-commerce, and supply chain management. By analyzing historical sales data, customer behavior, and market trends, businesses can forecast demand for products and services, optimize inventory levels, and improve supply chain efficiency.
Time series data analysis enables businesses to predict seasonal fluctuations in demand, identify patterns in consumer behavior, and adjust pricing strategies accordingly. By accurately forecasting demand, businesses can reduce stockouts, minimize excess inventory, and enhance customer satisfaction.
Moreover, demand prediction using time series data analysis is essential for capacity planning, production scheduling, and logistics management. By analyzing historical demand patterns and trends, businesses can optimize production processes, streamline distribution networks, and ensure timely delivery of products to customers.
In conclusion, the applications of time series data analysis are diverse and far-reaching, offering valuable insights and driving decision-making across various industries. By leveraging the power of time series data analysis, businesses and organizations can gain a competitive edge, improve operational efficiency, and deliver better services to customers.
Time series data analysis is a crucial aspect of data science, providing valuable insights into trends, patterns, and anomalies over time. By understanding effective methods for analyzing time series data, businesses and organizations can make accurate forecasts and informed decisions based on historical data. From forecasting trends to pattern recognition and anomaly detection, time series data analysis offers a powerful tool for data-driven decision-making. Leveraging methods such as ARIMA modeling, seasonal decomposition, and machine learning approaches, data scientists can extract meaningful information from time series data and make accurate predictions. Preprocessing techniques such as data cleaning, normalization, and feature engineering are essential for ensuring the quality of the data used for analysis. Evaluation metrics like RMSE and MAPE help in assessing the accuracy of time series models and forecasting performance. The applications of time series data analysis are diverse, spanning industries such as finance, healthcare, and retail, offering valuable insights and driving decision-making. Overall, time series data analysis is an indispensable tool for businesses looking to stay ahead in today’s competitive landscape.


Comments